

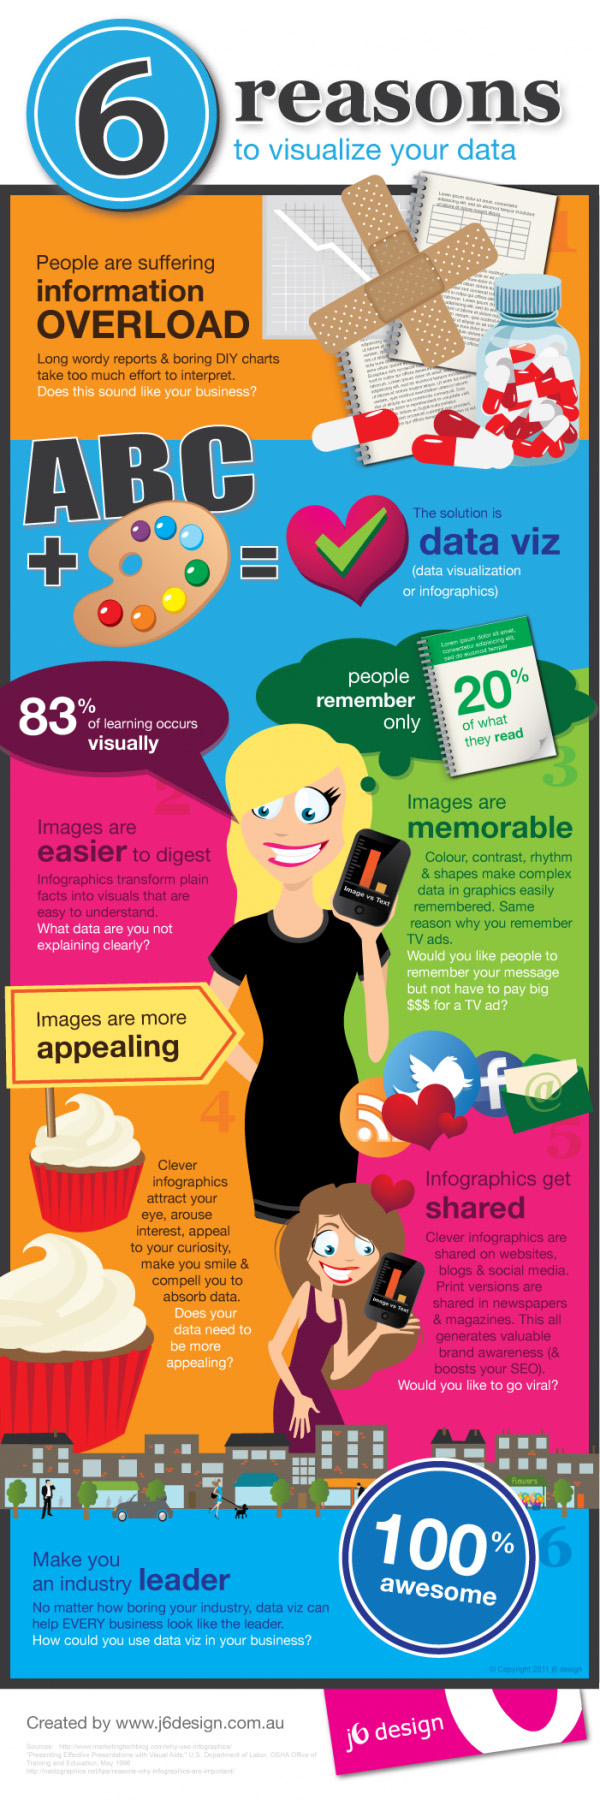
Long wordy reports & boring DIY charts take too much effort to interpret. Images are easier to digest infographics transform plain facts into visuals that are easy to understand. Images are memorable colour, contrast, rhythm & shapes make complex data in graphics easily remembered. Same reason why you remember TV ads.
Clever infographics attract your eye, arouse interest, appeal to your curiosity, make you smile & compel you to absorb data. Clever infographics are shared on websites blogs & social media. Print versions are shared in newspaper & magazines. This all generates valuable brand awareness.
(Click on the Image For Full View)
Source: j6design