

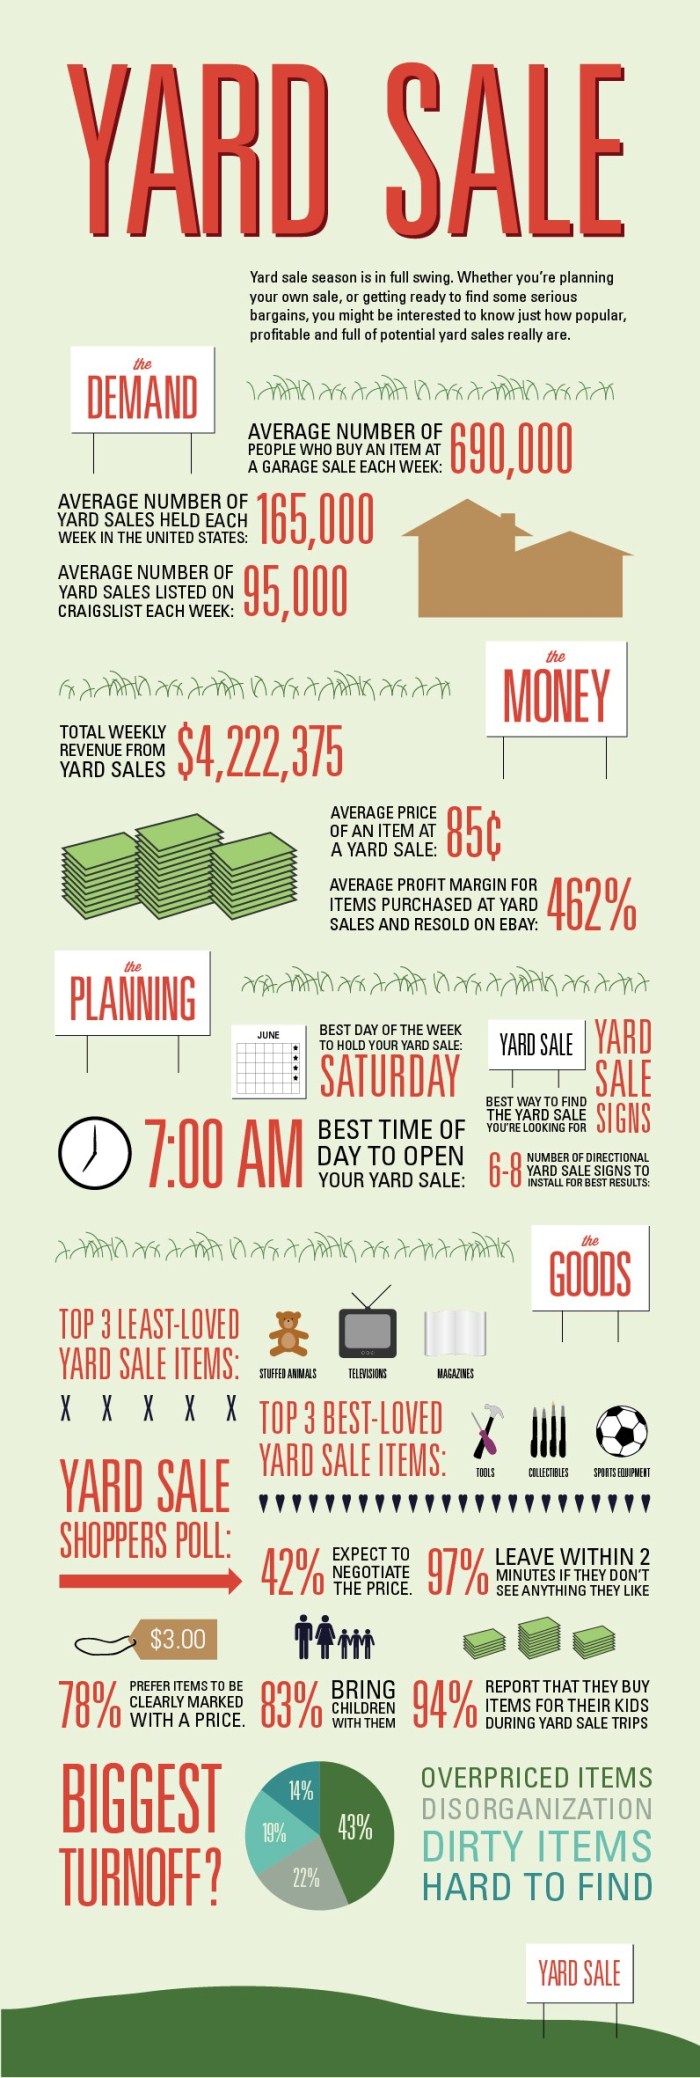
If you love yard sales and garage sales as much as us you’ve found the right infographic! Yard sale season is in full swing. Whether you’re planning your own sale, or getting ready to find some serious bargains, you might be interested to know just how popular, profitable and full of potential yard sales really are. We’ve put together some interesting facts and statistics on yard sales in the infographic below.
We’ll go through the demand, the money, the planning, and the goods that go into yard sales. We run down the numbers, things like, amount of people that buy an item at a yard sale per week, number of yard sales help per week, number of yard sale listed on Craigslist per week, total weekly revenue, average price of an item, average profit margin for items purchased at a yard sale, best day to hold your yard sale, best time to open, the best way to find the yard sale you’re looking for, the top 3 least loved items, the top 3 best loved items, the biggest turnoff, and more. If you’re looking for helpful tips and tricks these will be sure to open your mind and help you see how you can improve both your buying and selling strategies. Get your negotiating skills up and your prices down and they’ll be business to be done. We wish you success in your selling and shopping this summer!
(Click on the Image For Full View)
 Source: signs